Direct drive
SEE WHAT CHANGES.
A geared electric drive and the ZENIT direct-drive concept, side by side.
Swipe across the animation to view the complete drive.
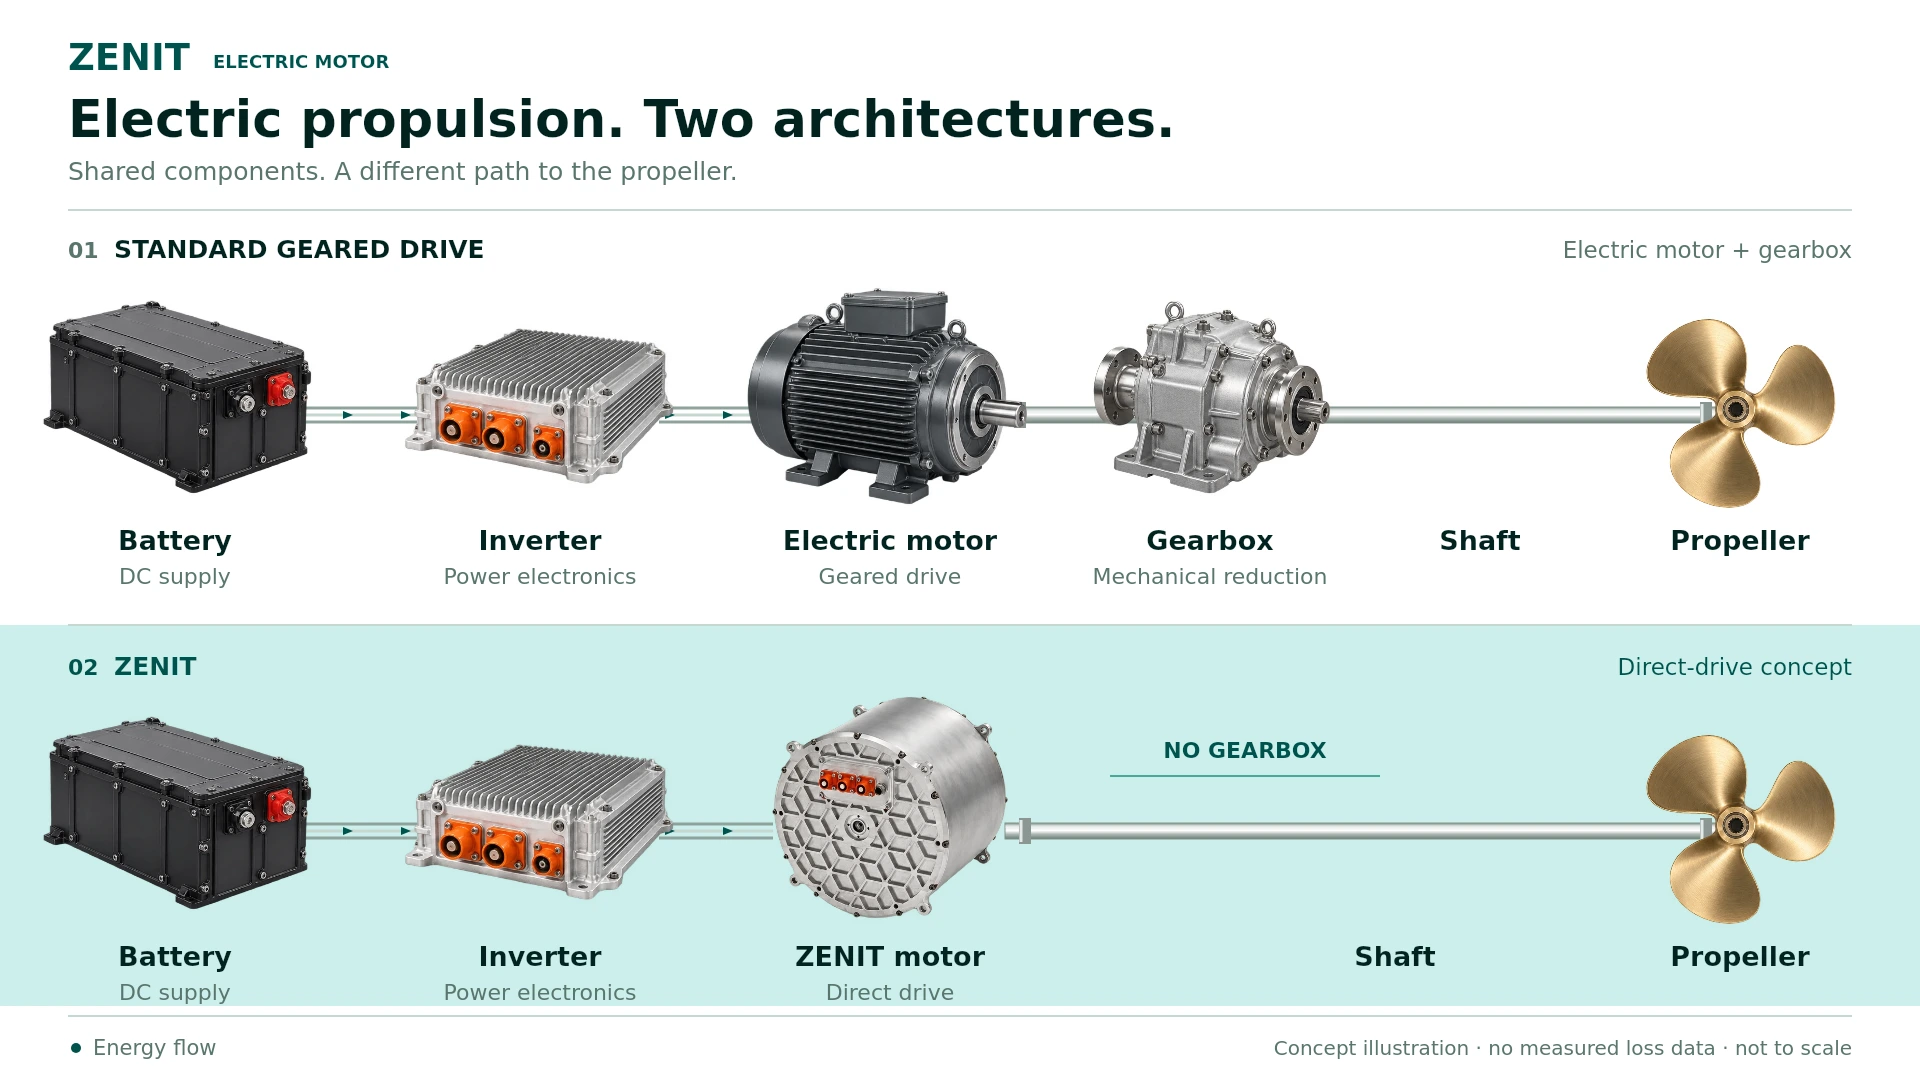
Battery, inverter and propeller are identical in both illustrations. Component sizes, rotational speeds and heat losses are schematic. Actual component selection depends on the application.
Download animation · MP4Motor efficiency
TWO CURVES.
ONE DIFFERENCE.
The upper graph compares the two motors. The lower graph shows the gap between them at the same motor speed.
Efficiency vs motor speed
- ZENIT motor
- Conventional motor
Efficiency · η
The efficiency difference
Δη = ηZENIT − ηconventional
Efficiency difference · Δη (same vertical scale as above)
A larger gap above means a higher curve here. The baseline represents equal efficiency.
Move the slider, or point to either graph. The markers connect the two views.
These curves compare motor efficiency only; gearbox and other system losses are excluded. Actual efficiency depends on torque and operating conditions. View the ZENIT efficiency map.